Monitor ethOS Distro with Elastic Search - 1

TL;DR: It's possible to monitor your ethos distro install on an ElasticSearch instance.
I like EthOS. I like its panel too, but at the time of writing it had some issues on updating values This was somewhat unfortunate because it's the same time when I set up my rig so monitoring without typing show stats every minute or so was quite important. So, I've proceeded to try and find a replacement for the panel.
Initially, I've thought to develop my own solution with something like django, but since I'm not sure what I want to monitor, it would be pretty difficult to define the relational model :(. After looking online, I've settled on ElasticSearch (ES) and Kibana as my solution.
This series is split in more posts:
-
Configure ElasticSearch and Kibana (this)
Several options for installing ES and Kibana exist. You can install them on your desktop, on a server or via a docker image. I've selected the docker image option as I have a Synology NAS available.
ElasticSearch
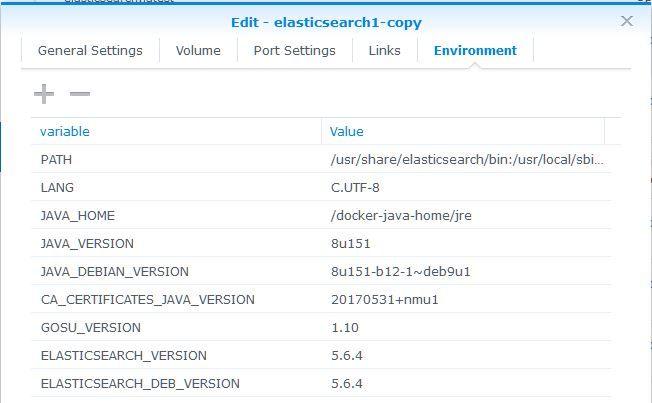
I've installed the default ES image, taking care to map /usr/share/elasticsearch/data to a volume, so we keep the indices between ES runs. On my Synology, the setup looks like:


The output port is 39200.
Once ES is up and running, you can already create an index via a PUT command:
curl -XPUT 'http://my.ip.addr:9200/twitter/'
I've decided to wait until I've installed Kibana because it offers a Console (in Dev Tools) where you can type raw ES commands :).
Kibana
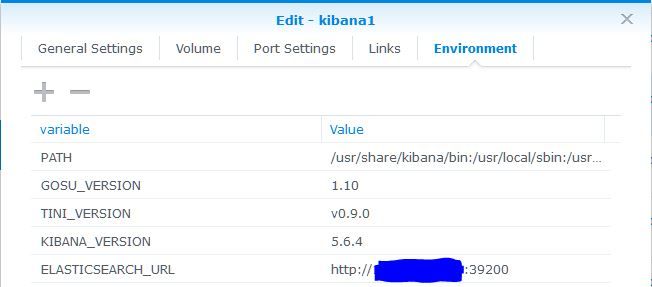
I've followed the same process for Kibana:
- Download the default image
- Create a container with:
- Environment:
ELASTICSEARCH_URL=http://my.nas.ip:39200 - Exposed port:
35601
- Environment:
- Run the container
It looks like this:


Configure ES
The first iteration of my script was pushing the same data to ES as to the ethOS panel. I had no errors whatsoever, but all values were strings, making it difficult to aggregate. The data set also did not include timestamps.
Timestamps
I've added a timestamp value to the dataset which I made sure was sent as numeric. However, I had several problems in Kibana:
- The value was missing for the initial entries
- It was interpreted as a number rather than a time
I could get over the missing values as I could set the time window to last 24 hours, but I couldn't use Kibana's Timelion to plot time series. Ouch. I found out that I needed to explicitly tell ES that my timestamp field is actually a timestamp. ...And one cannot do it on an existing index :(. The result was that I would need to:
-
remove the existing index
curl -XDELETE 'http://localhost:9200/twitter/' -
recreate it
put ethos -
set the timestamp field type
PUT ethos/_mapping/doc
{
  "properties": {
      "timestamp": {
          "type": "date"
      }
  }
}
All of the above you can type in Kibana's Dev Tools > Console
Now, everything is prepared for pushing data and measuring it. Next part shows how to push the data to ES.
HTH,

