Draw Graphs with JSON Data

Previous postdealt with sending JSON data around. Now, I need to be able to draw it. After looking for graphing libraries, I've settled on Chart.js and on CanvasJS.
Common steps
All graphs need a canvas element to function:
<div id="chartContainer" style="height: 300px; width: 100%;">
  <canvas id="chartCanvas"></canvas>
</div>
First thing I wanted, was to get the data with AJAX. This way, my page would not really get blocked (hopefully). So, the AJAX bit (via jQuery) is quite simple:
$.ajax({
  url: '/transaction/json',
  method: 'GET',
  datatype: 'json',
  success: function(data) {
    //
    // Graph drawing here
    //
  },
  error: function(data) {
    console.log(data)
  }
})
When the data gets in, It'll contain dictionaries with 2 items. The "x" field is a data sent as a string. We need to vonvert it. We also need to replace the transation values with a cummulative value. The code looks sonething like this (placed in the "Graph drawing here" scope:
let rawData = data['data']
let history = 0.0
for (let i = 0; i < rawData.length; i++) {
  rawData[i]['x'] = new Date(rawData[i]['x'])
  rawData[i]['y'] = rawData[i]['y'] + history
  history = rawData[i]['y']
}
At this point, we have the appropriate data and types in the "x" and "y" components.
CanvasJS
First, we need to iplort CanvasJS:
<script src="https://canvasjs.com/assets/script/canvasjs.min.js"></script>
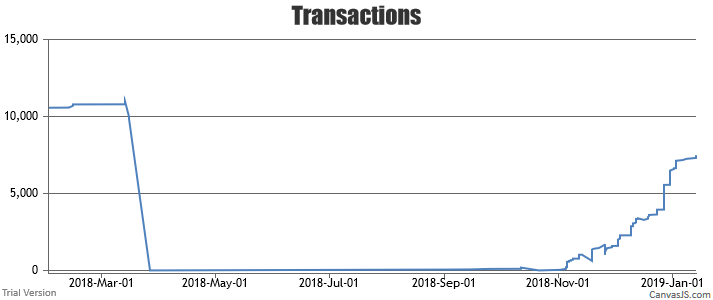
Plotting the data with CanvasJS was a breeze once I figured out how to do the labeling. First, I've created the configuration object (just after the data preparation) :
let options = {
  title: {
    text: 'Transactions'
  },
  axisX: {
    valueFormatString: 'YYYY-MMM-DD'
  },
  axisY: {
    minimum: -200
  },
  data: [
    {
      type: 'line',
      markerType: 'none',
      dataPoints: rawData
    }
  ]
}
The above code sets:
- The graph title
- the X axis labels
- The Y axis minimum range
- The data plot (the dataset, graph and marker types)
Now we only have to actually draw the graph:
let chart = new CanvasJS.Chart('chartContainer', options)
chart.render()
The result is below:
 CanvasJS
Chart.js
We need to import Chart.js. We also need to import moment.js because we'll use it to format the x-axis' labels:
<script src="https://momentjs.com/downloads/moment.js"></script>
<script src="https://cdnjs.cloudflare.com/ajax/libs/Chart.js/2.7.3/Chart.bundle.js"></script>
Chart.js has a similar approach, although configuration is more verbose:
let options = {
  type: 'line',
  data: {
    datasets: [
      {
        label: 'Expenses',
        lineTension: 0,
        fill: false,
        borderColor: '#8BC34A',
        pointRadius: 2,
        data: rawData
      }
    ]
  },
  options: {
    legend: {
      display: false,
      labels: {
        fontColor: 'rgb(255, 99, 132)'
      }
    },
    scales: {
      xAxes: [
        {
          type: 'linear',
          position: 'bottom',
          ticks: {
            callback(value) {
              let time = moment(value)
              return time.format('MM/YYYY')
            }
          }
        }
      ]
    }
  }
}
We set up:
- The data set (values, color...)
- We hide the legend, because we know what's plotted
- We set up the x-axis' labels via a callback
Now, we need to render the graph:
let ctx = document.getElementById('chartCanvas').getContext('2d')
new Chart(ctx, options)
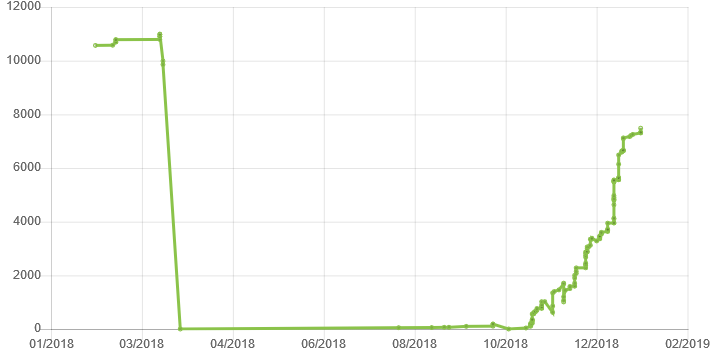
The result is:
 Chart.js
Conclusion
As you've seen, the effort to plot data is roughly the same. You need dictionaries with "x" and "y" keys, where "x" contains the date and "y" contains the value. Chart.js is a bit more verbose to configure, but results are similar.

