Monitor ethOS Distro with Elastic Search - 2

Following the previous post, we are now in position to install the monitoring code on the monitoried machine, of course. The easiest way is to download the code on the machine in /home/ethos. Following steps will assume you have the unpacked code in
/home/ethos/ethos-elasticsearch
Once you have downloaded the code, you need to add the location of the ElasticSearch server to the local.conf:
#...

es_server http://192.168.0.110:9200/ethos/doc  # <--- This

#...
Dissecting the scripts
The scripts are written in PHP, like ethOS's own scripts. I did that for two reasons:
- Take advantage of the already written code (parsing and stuff)
- Make it easier for users to adapt and improve the code with their own tweaks
The scripts follow the same structure too:
bin/contains monitoring the scriptlib/contains various helper librariessbin/contains a daemon-like script which can be executed as a once-off or as a loop.
lib
The lib directory extends the functions already present in /opt/ethos/lib. More specific, the data array is extended with numeric variants for text fields. New fields like cores, voltages, miner_hash_values and fan_rpms are added to the array. A function to send the array via curl and a POST request is also present, to allow pushing data to ElasticSearch.
The full list of variables added (at the moment of writing) are:
$send['cores'] = to_num_array($send['core']);
$send['voltages'] = to_num_array($send['voltage']);
$send['miner_hash_values'] = to_num_array($send['miner_hashes']);
$send['fan_rpms'] = to_num_array($send['fanrpm']);
$send['fan_percents'] = to_num_array($send['fanpercent']);
$send['powertunes'] = to_num_array($send['powertune']);
$send['vramsizes'] = to_num_array($send['vramsize']);
$send['a_bioses'] = explode(' ', $send['bioses']);
$send['cpu_temp'] = floatval($send['cpu_temp']);

$send['avg_core'] = avg($send['cores']);
$send['avg_rpms'] = avg($send['fan_rpms']);
$send['avg_hashes'] = avg($send['miner_hash_values']);
$send['gpus'] = floatval($send['gpus']);
$send['sum_hashes'] = array_sum($send['miner_hash_values']);
$send['val_hash'] = floatval($send['hash']);

$send['a_temp'] = to_num_array($send['temp']);

$send['val_tx_kbps'] = to_num_array($send['tx_kbps']);
$send['val_rx_kbps'] = to_num_array($send['rx_kbps']);

$send['a_default_core'] = to_num_array($send['default_core']);
$send['a_default_mem'] = to_num_array($send['default_mem']);
$send['a_core'] = to_num_array($send['core']);
$send['a_mem'] = to_num_array($send['mem']);
sbin
This directory contains a script which can be executed either as a one-off or as a adaemon in background. Its usage is:
./ethos-stats-es-daemon [once-off] <ES-URI>
The [once-off] implies an optional word which specifies the script is sending the data only once. The <ES-URI> specifies the ES url wher ewe want the data do be sent to.
bin
This is the wrapper script which allows you to just run it:
./update-es
It reads the ElasticSearch URI from local.conf with:
ES_SERVER=$(grep -m 1 -Poi "(?<=^es_server)\s+(.*)" "$CONF" |xargs)
and executes the daemon script as a once-off:
${SCRIPT_PATH}/../sbin/ethos-stats-es-daemon refresh "${ES_SERVER}"
Running it all
The easiest way to execute the update script is via a cronjob. I'm executing it every 10 minutes:
10 * * * * /home/ethos/es-monitoring/bin/update-es >/tmp/es.log 2>&1
You can also execute directly the daemon, but then you'll need to parse the ElasticSearch URI yourself.
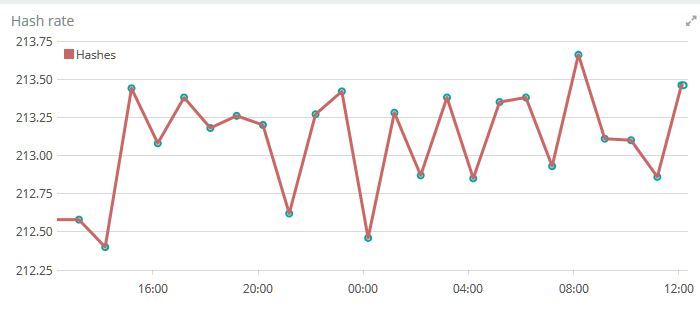
The next article will give some example of visualisations with Kibana, like this:

HTH,

