
Pretty labels in Flux (and Grafana)
I've been looking for a way to make the graph prettier and I looked at the Flux language and even using transformations in grafana itself.


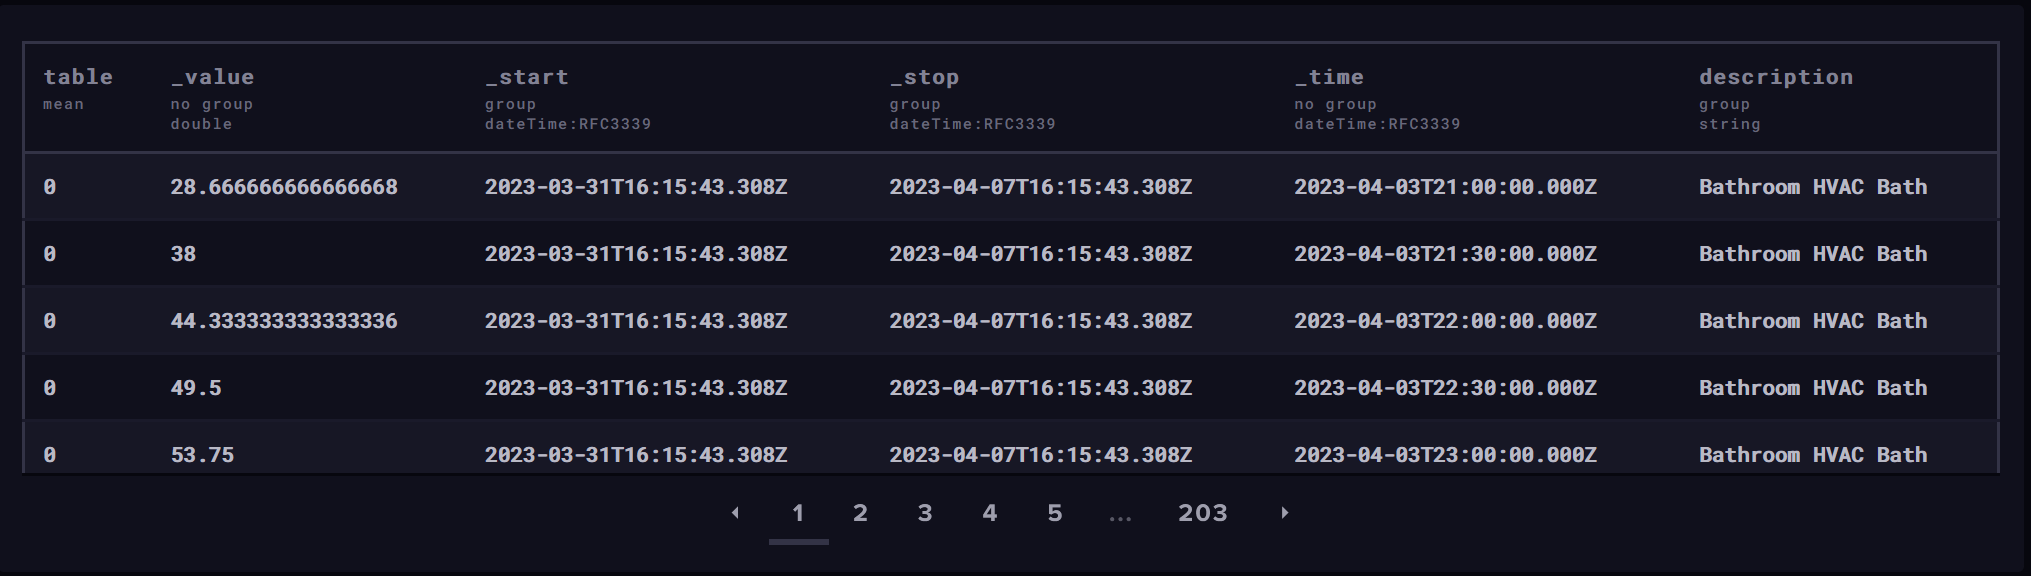
Last year I've set up the KNX monitor to grab temperature and valve percentages. The data is stored in InfluxDB in a table containing:
- The measured value
- KNX group address information (from the KNX configuration):
- Description
- Destination
- Name
The table itself looks somewhat like this (see also the fields beginning with "_"):
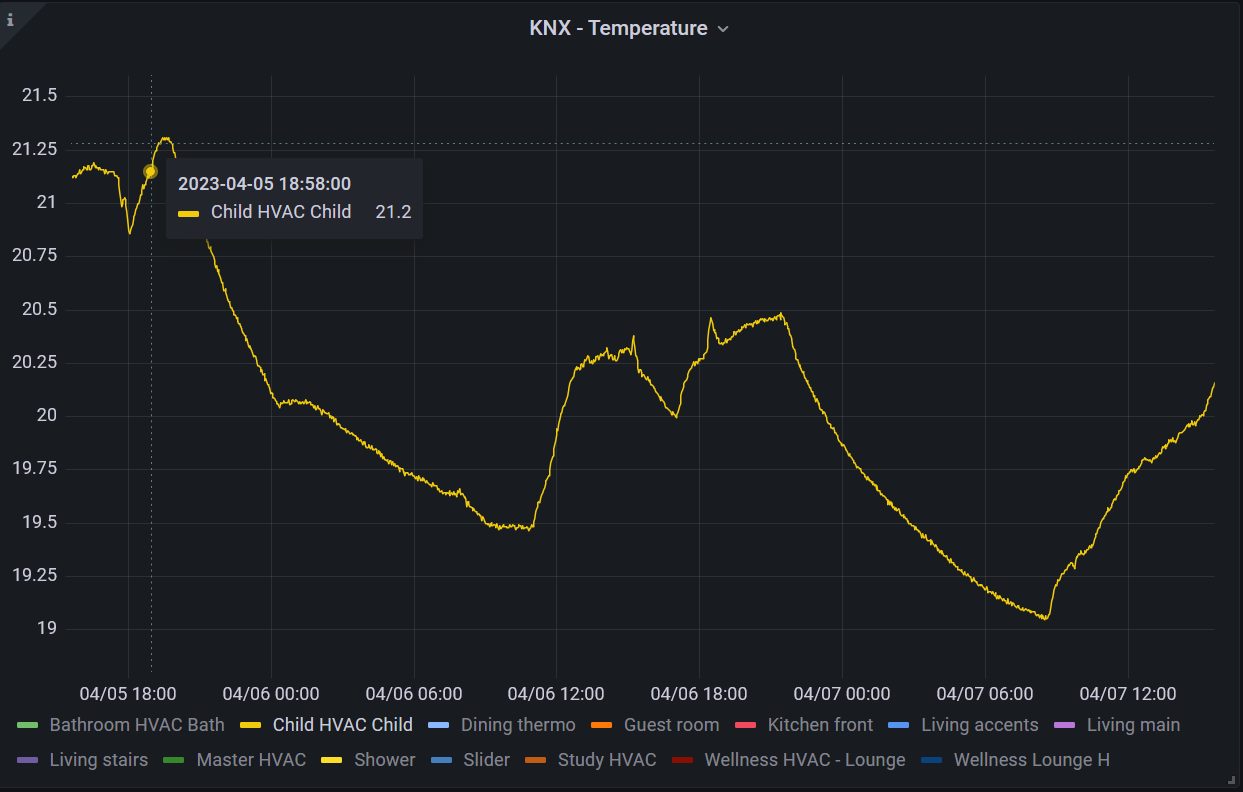
For a while now I've been struggling with unsightly labels in my KNX graphs, coming from InfluxDB, which looked like this:

As you can see, the legend is quite verbose and not user friendly at all. I've been querying data with a Flux query:
import "strings"
from(bucket: "home")
  |> range(start: v.timeRangeStart, stop: v.timeRangeStop)
  |> filter(fn: (r) => r["_measurement"] == "KNX-DPST 9.1")
  |> filter(fn: (r) => strings.containsStr(v: r["name"], substr: "CTEMP"))
  |> aggregateWindow(every: v.windowPeriod, fn: mean, createEmpty: false)
  |> yield(name: "mean")
I've been looking for a way to make the graph prettier and I looked at the Flux language and even using transformations in grafana itself. However, the correct answer was sort of staring at me all this time via the group function:
group(columns: ["description"])
And the result was instant:
My take is that a flux query groups the data by the first explicit column (which happened to be the description). Performing an explicit group, would automatically select the group column only.
My query now is:
import "strings"
from(bucket: "home")
  |> range(start: v.timeRangeStart, stop: v.timeRangeStop)
  |> filter(fn: (r) => r["_measurement"] == "KNX-DPST 9.1")
  |> filter(fn: (r) => strings.containsStr(v: r["name"], substr: "CTEMP"))
  |> group(columns: ["description"])
  |> aggregateWindow(every: v.windowPeriod, fn: mean, createEmpty: false)
  |> yield(name: "mean")
Great! Now the next step is to set up bi-graphs with temperature vs valve opening to see if everything works properly :) (yeah, the HVAC builders forgot to give me the mapping between valves and rooms)..
HTH,